
MU Stock Is Down 24% While Micron's Profits Hit Records

 Prefer us on Google
MU stock closed at $949.83 on August 17, 2026 — roughly 24% below its 52-week high of $1,255, and still more than eight times its 52-week low of $113.46. Both facts are true at the same time, and that tension is the whole story.
Micron just guided to $50 billion of quarterly revenue with an 86% gross margin. A company posting those numbers is not usually trading at a single-digit earnings multiple. MU stock does. Understanding why is the difference between reading a quote page and understanding the position.
MU stock by the numbers, as of August 18, 2026
| Metric | Value | As of |
|---|---|---|
| Share price (close) | $949.83 | Aug 17, 2026 |
| 52-week range | $113.46 – $1,255.00 | Aug 2026 |
| Drawdown from high | −24.3% | Aug 17, 2026 |
| Market cap | ~$1.03T | Aug 17, 2026 |
| Q3 FY26 revenue | $41.46B (+74% YoY) | Reported Jun 2026 |
| Q3 FY26 gross margin | 84.9% | Reported Jun 2026 |
| Q3 FY26 EPS | $25.11 | Reported Jun 2026 |
| Q4 FY26 guidance | $50.0B ±$1.0B revenue, ~86% GM, $31.00 ±$1.00 non-GAAP EPS | Company guidance |
| Next earnings | Sept 29, 2026 | Scheduled |
| Annual dividend | $0.60/share (~0.06% yield) | Aug 2026 |
| WEEX MU/USDT perpetual, last | 953.61 | Aug 18, 2026 |
Two numbers in that table do the heavy lifting. Run the guided $31 quarterly EPS out four quarters and you get roughly $124 of annualized earnings power — about 7.7 times the current share price. And the WEEX perpetual was quoting 953.61 against a $949.83 cash close, a premium of about 0.4%, which tells you leveraged positioning is still tilted long even after a 24% drawdown.
Why is MU stock down 24% if earnings are exploding?
Because the market is not paying for this quarter. It is paying for the quarter after the cycle turns.
Memory is the most violently cyclical business in semiconductors. DRAM and NAND are commodities with a handful of suppliers, multi-year fab lead times, and near-zero marginal cost once a line is running. When supply is tight, pricing runs away from cost and margins go vertical — DRAM contract prices rose roughly 90% in Q1 2026. When supply catches up, the same operating leverage runs in reverse and margins can go negative within a few quarters. Micron has printed losses at the bottom of prior cycles.
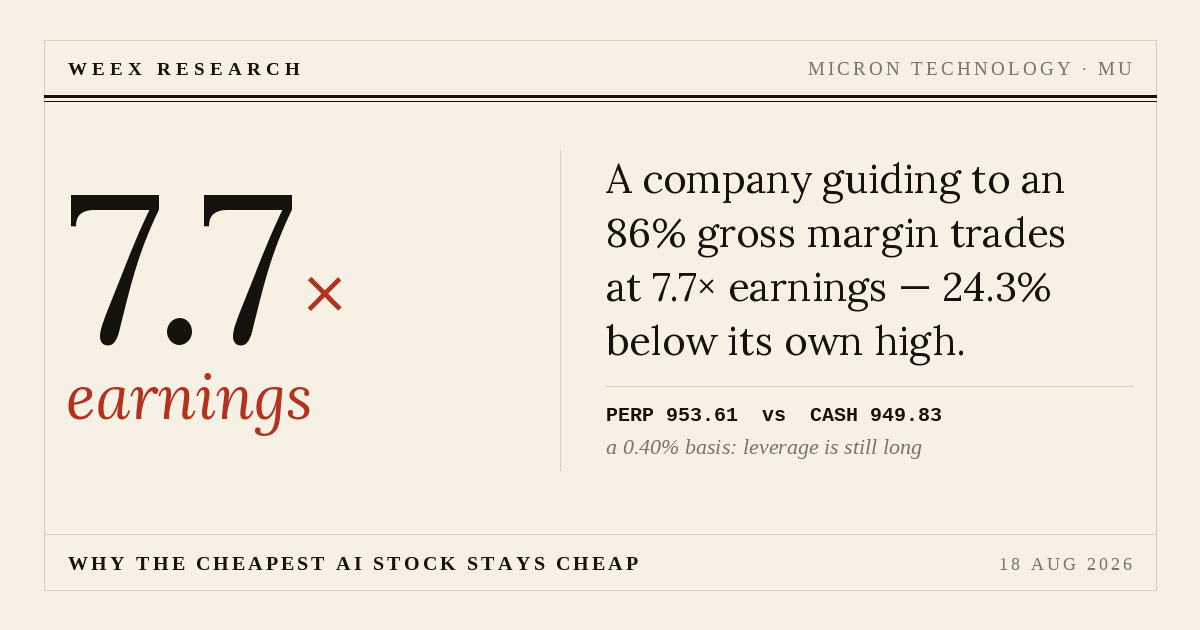
So a 7.7x multiple is not a valuation argument. It is the market's estimate that $124 of annual EPS is peak earnings, not run-rate earnings. Every memory cycle in the last thirty years has ended with the stock de-rating before the earnings did. Traders who buy MU stock because "the P/E is low" are buying the single most reliable value trap in the sector.
The counter-case is that this cycle is structurally different: HBM is sold under multi-year contracts rather than spot, which flattens the pricing whipsaw, and Micron's management has said supply stays tight beyond 2027 — with 2027 tighter than 2026. Micron has also locked in demand directly, including a multi-year agreement to supply memory and storage for Anthropic's AI workloads. If contract visibility genuinely replaces spot volatility, the historical de-rating logic weakens.
The more important point: the bull and bear cases here are not arguing about Micron's demand. They agree demand is enormous. They are arguing about supply discipline — whether Samsung, SK Hynix and Micron can resist adding capacity into an 86% gross margin. History says they cannot. That is the actual question behind MU stock.
What 86% gross margin really tells you
Put the margin in context. Across a full cycle, memory manufacturers have historically averaged gross margins in the 30–45% range, with troughs below zero. An 86% guide is not a moat — it is a shortage. Moats produce durable margins; shortages produce spectacular ones that end.
That does not make the number bearish today. It makes it a clock. The useful thing to watch is not Micron's earnings, which will look excellent for several more quarters, but the capex announcements coming out of Samsung and SK Hynix, and the wafer-start figures Micron discloses. New DRAM capacity takes roughly 18–24 months from decision to output. The de-rating in MU stock typically begins when those announcements land, not when the revenue finally rolls over.
-- Price
MU stock price targets span $489 to $1,625
Analyst dispersion on MU stock is unusually wide right now, which is itself information — it means the sell side has no shared view on where in the cycle we are.
| Target | Source | Implied vs $949.83 |
|---|---|---|
| $489–$536 | Older, pre-revision targets | −49% to −44% |
| $1,087 | Median 12-month consensus | +14% |
| $1,250 | New Street Research | +32% |
| $1,300 | Wedbush | +37% |
| $1,500 | TD Cowen (raised from $660) | +58% |
| $1,550 | Needham | +63% |
| $1,625 | UBS | +71% |
Note what TD Cowen's revision actually shows: a target moved from $660 to $1,500. That is not a refined model, it is a capitulation to price. Treat the high end of this range as momentum extrapolation rather than independent analysis, and treat the median as the more honest reading.
How to trade MU stock with USDT on WEEX
If you hold USDT rather than a US brokerage account, there are three structurally different ways to get MU exposure, and they are not interchangeable.
| US brokerage shares | Tokenized MU stock | MU/USDT perpetual | |
|---|---|---|---|
| What you own | The equity | A token tracking the price | A contract, price exposure only |
| Settlement | USD | USDT | USDT |
| Leverage | Margin, typically ≤2x | None | Up to 100× |
| Dividend / voting | Yes | No | No |
| Can short | Requires borrow | No | Yes, natively |
| Funding cost | Margin interest | None | Periodic funding payments |
| Main risk | Market risk | Issuer / redemption risk | Liquidation, funding drag |
On WEEX, MU exposure runs through MU/USDT perpetual futures, part of the WEEX TradFi futures product line that also covers metals, crude oil and other equities. Stock perpetuals there support up to 100× leverage with USDT margin, two-way positioning, and fees as low as 0%. If you want the NAND-heavy expression of the same memory cycle rather than the DRAM-heavy one, the SNDK/USDT perpetual tracks SanDisk, which was quoting 1,716.64 on August 18, 2026.
Practically: 100× leverage on a stock that has moved 24% in a drawdown is not a tool, it is a countdown. A 1% adverse move against a 100× position is a full liquidation. On a name with MU's realized volatility, single-digit leverage is the honest ceiling for a directional view.
What MU stock traders on perpetuals usually miss
This is the part the quote pages will never tell you, and it costs people money.
TradFi perpetuals follow the underlying market's hours. Unlike a crypto perpetual, you can generally only open or close an equity contract while the reference market is open. That means a gap-risk window: Micron reports on September 29, 2026, and if the print moves the stock sharply, your position reprices before you have any ability to exit. Stop-losses do not protect you across a closed market.
Funding can still accrue while you cannot trade. WEEX notes that funding fees may apply during certain periods even outside active hours. A leveraged position held through a weekend or a holiday can bleed carry while you are locked out of managing it. Size positions on the assumption that you will be unable to touch them for stretches.
The perpetual is not the share. No dividend, no voting rights, no claim on the company. That is fine for a trade and wrong for a thesis — if your view on MU stock is a three-year one about the AI memory buildout, a leveraged perpetual is the wrong instrument to express it in.
What would break the MU stock bull case
- Capacity announcements. Any large DRAM capex commitment from Samsung or SK Hynix starts the clock on the supply response.
- Hyperscaler capex guidance. AI infrastructure spend is the demand side. A single major cloud provider trimming its 2027 budget would hit MU stock harder than a Micron miss.
- HBM4 execution. Yield problems on the HBM4 ramp would cost Micron share in the only segment where pricing power is genuinely contract-protected.
- Margin, not revenue. The tell will show up in gross margin guidance before it shows up in revenue. Watch the 86% number on September 29.
- Export controls. Memory sits directly in the middle of US-China semiconductor policy, and rules have changed with little warning before.
The bottom line on MU stock
MU stock is not cheap and it is not expensive — it is a cyclical priced for the cycle to end. At $949.83 with roughly $124 of annualized earnings power, the market has already told you it does not believe these margins last. Your job is not to decide whether Micron is a good company. It obviously is, right now. Your job is to decide whether supply discipline holds long enough for the current earnings to be worth more than one multiple turn.
If you want exposure without a brokerage account, USDT-settled products make MU tradable from a crypto wallet — but treat leverage as the risk it is, and note the September 29 earnings date before you size anything. Open a WEEX account to view live MU/USDT pricing, funding rates and contract specifications before committing capital.
FAQ
1. Why is MU stock down if Micron's earnings are at record highs?
The market prices memory stocks on where the cycle is going, not where earnings are. MU stock trades near 7.7× annualized guided earnings because investors treat the current 86% gross margin as a peak rather than a baseline. Falling multiples ahead of falling earnings is the normal pattern in memory.
2. Does MU stock pay a dividend?
Yes, but it is nominal — about $0.60 per share annually, a yield near 0.06% at the August 2026 price. Nobody owns Micron for income. Note that USDT-settled tokenized stocks and perpetual futures do not pay dividends at all.
3. When does Micron report next?
Q4 FY2026 results are scheduled for September 29, 2026. Company guidance calls for $50.0B ±$1.0B in revenue, gross margin near 86%, and non-GAAP EPS of $31.00 ±$1.00.
4. What is the price target range for MU stock?
Published 12-month targets currently span roughly $489 to $1,625, with a median near $1,087 — about 14% above the August 17, 2026 close. The width of that range reflects genuine disagreement about cycle timing, not a consensus view.
5. Can I trade MU stock if I only hold USDT?
Yes. MU/USDT perpetual futures on WEEX give USDT-margined long or short exposure to Micron's price with up to 100× leverage, without a brokerage account. You get price exposure only — no shares, dividends or voting rights — and the contract follows the underlying market's trading hours.
Risk Warning
Trading MU stock exposure through leveraged derivatives carries substantial risk of partial or total loss of capital. Micron is a highly cyclical semiconductor issuer whose margins have historically swung from above 80% to below zero within a few years, and the stock has already moved more than eightfold from its 52-week low. Specific risks include liquidation risk (a 1% adverse move fully liquidates a 100× position), gap risk across closed market hours around the September 29, 2026 earnings report, funding costs that can accrue while positions cannot be managed, and the absence of shareholder rights in USDT-settled products. Regulatory treatment of tokenized equities and equity perpetuals varies by jurisdiction and may change. All figures are dated as shown and will move. Nothing here is investment advice; assess your own experience, financial position and risk tolerance before trading, and consider independent professional advice.
This content is provided for general informational purposes only and doesn't constitute financial, investment, legal, or tax advice. Any events, rewards, online promotions, or related information mentioned herein should not be considered a recommendation, solicitation, or invitation to purchase, sell, trade, or otherwise deal in any crypto assets. Crypto assets are highly volatile and may result in loss. The availability of WEEX services, products, and related events may vary by region. You are responsible for ensuring that your participation is in accordance with applicable local laws and regulations.
You may also like

SNDK Stock Price Surges Past $1,700: What the Five-Day Winning Streak After Investor Day Actually Signals
OpenAI Stock Price: What Investors Who Want Exposure to ChatGPT Can Actually Buy Today

What Is OpenAI Stock? Why You Cannot Buy It Yet and What the IPO Timeline Actually Looks Like
XSolut, Stealth, or a Copycat? The XST Ticker Confusion Explained 2026

NVDA Stock Price Before August 26 Earnings: What Bank of America's $94-95 Billion Revenue Estimate Actually Requires
Nike Stock Price Prediction 2026-2027: Can NKE Recover After Hitting an 11 Year Low

How to Invest in XST Coin: What Due Diligence Actually Requires Before Buying XSolut

XST Coin on Coinbase: Why the Tokens You Find There Are Not the Real XSolut

XST Coin Has Fallen More Than 50% From Its All-Time High: What the Correction After the Peak Actually Means
MRVL Stock Before August 27: The Number That Decides the Print

Kioxia Stock Before the Oct 1 Split: The 24/7 Perp Problem
Dow Jones Today: The 5.31% Yield Matters More Than the Dip
SNDK Stock: Inside the 56% Crash and 76% Rebound of 2026
Why Is ZEC Price Up Today? Zcash Jumps 5% as Trading Volume Surges
Pakistan Stock Market Gains 23% in One Year: What Is Driving the PSX Rally?

PSX Today: KSE-100 Closes Above 180,500 as Trading Activity Surges
ZKsync (ZK) Price Today: How the Latest ZKsync Token Unlock Could Affect Trading Liquidity
ZKsync (ZK) Token Release Explained: Circulating Supply, Unlock Schedule and Market Impact
What Is Driving MANTA/USDT Volatility? Manta Network Tokenomics and Market Catalysts
MANTA Price Today: What Traders Are Watching Around the Latest Token Release

Ether.fi (ETHFI) Token Unlock on August 18, 2026: Release Size, Schedule and Market Impact
Is MU Stock Cheap at 20x Earnings Despite 346% Revenue Growth? What the Valuation Gap Actually Means
SPYB Price Holds Near Record After US Retail Sales Miss
New Street Upgrades MU Stock to Buy: What Reaching Multi-Trillion Market Cap Requires
BlackBerry Stock Up 125%: Why BB and BBX Are Not the Same
Netflix Stock Is Down 38%: What the Tape Is Pricing
USDT to MYR: Why Every Converter Quotes a Different Rate
Nasdaq Futures vs Stocks: NQ at 30,141 and 3 Ways to Trade
XST Coin Has $12,000 of Real Depth Behind a $31 Million Price
XST Coin Buyer's Safety Guide: How to Verify the Real XSolut Token on Solana
SNDK Stock Price Surges Past $1,700: What the Five-Day Winning Streak After Investor Day Actually Signals
OpenAI Stock Price: What Investors Who Want Exposure to ChatGPT Can Actually Buy Today
What Is OpenAI Stock? Why You Cannot Buy It Yet and What the IPO Timeline Actually Looks Like
XSolut, Stealth, or a Copycat? The XST Ticker Confusion Explained 2026
NVDA Stock Price Before August 26 Earnings: What Bank of America's $94-95 Billion Revenue Estimate Actually Requires
Nike Stock Price Prediction 2026-2027: Can NKE Recover After Hitting an 11 Year Low
Contents
Popular coins
Latest articles


